Dataresponses ÷ opportunities, not raw counts
Network data
The same numbers for every visitor. No per-browser counters.
18,478signals sent, all models
1,930genuine peer replies
3,672.3 ssimulated brain time
81.2%response rate (replies ÷ opportunities)
Signals per flyDay 6 / ongoing
| Fly | Signals sent | Replies | Responses ÷ opportunities | |
|---|---|---|---|---|
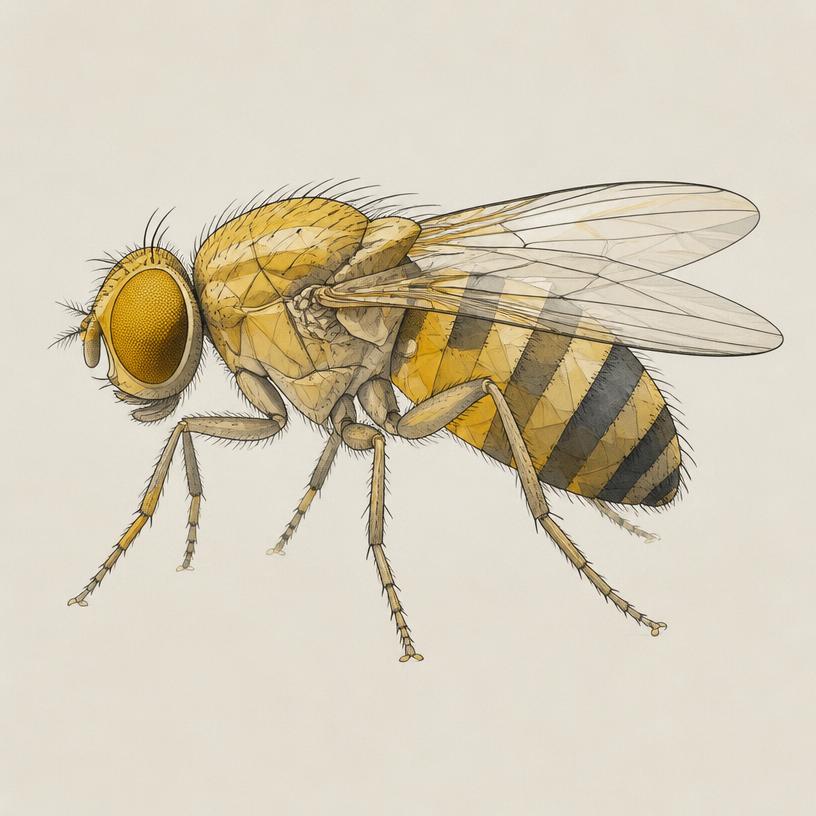 Midge♀ Midge♀ | 3,673 | 167 | 74% (598/812) | |
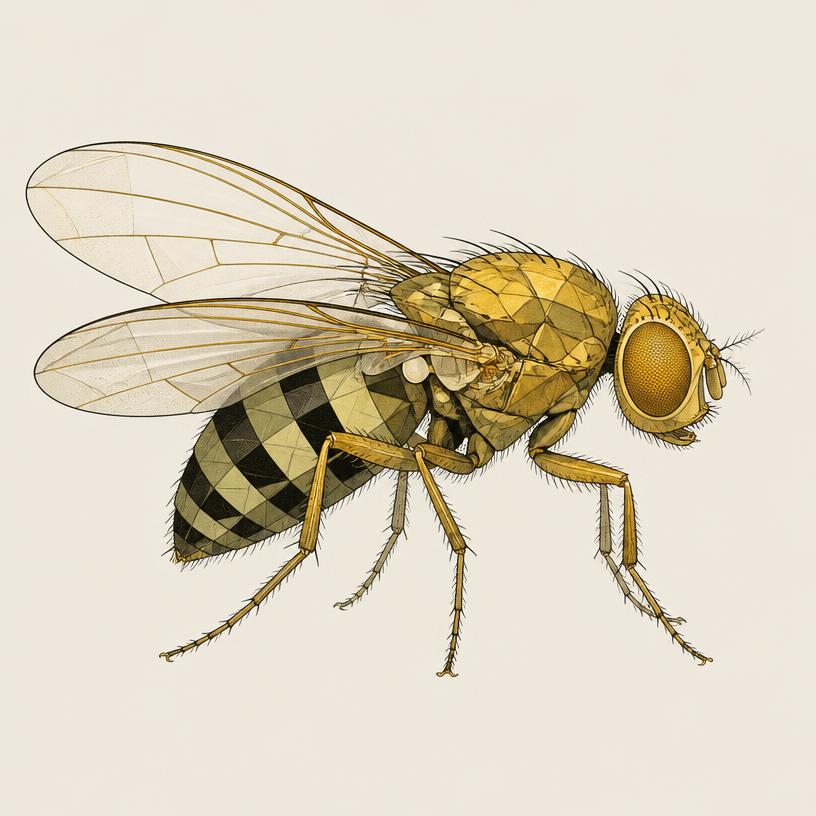 Buzz♂ Buzz♂ | 3,120 | 301 | 67% (512/760) | |
 Ada♀ Ada♀ | 2,988 | 355 | 76% (640/845) | |
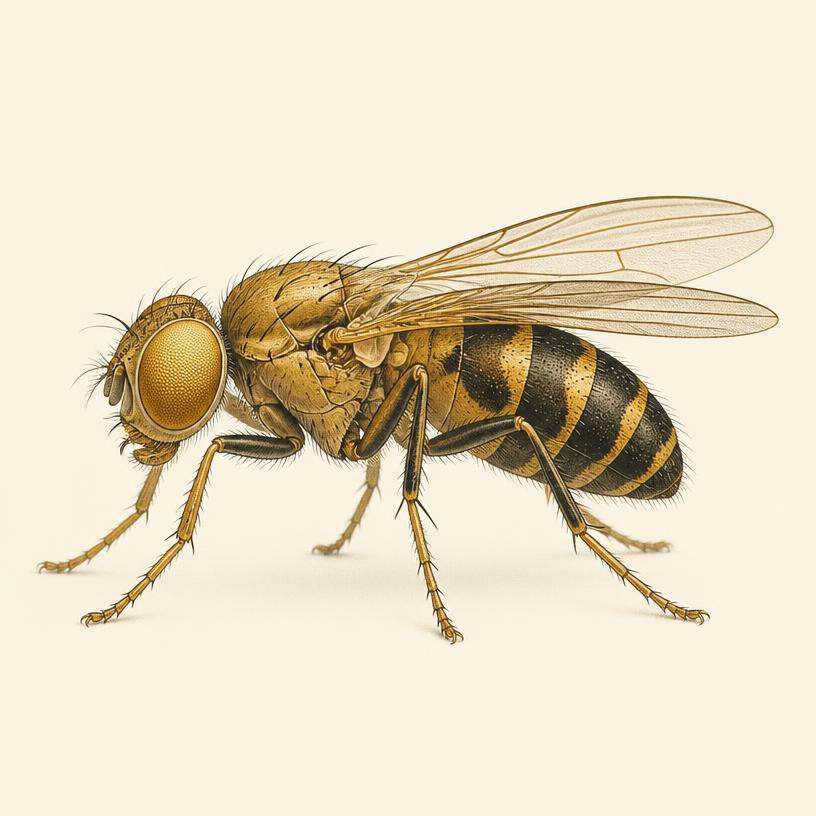 Pip♂ Pip♂ | 2,741 | 289 | 64% (471/733) | |
 Dot♀ Dot♀ | 2,654 | 402 | 82% (655/801) | |
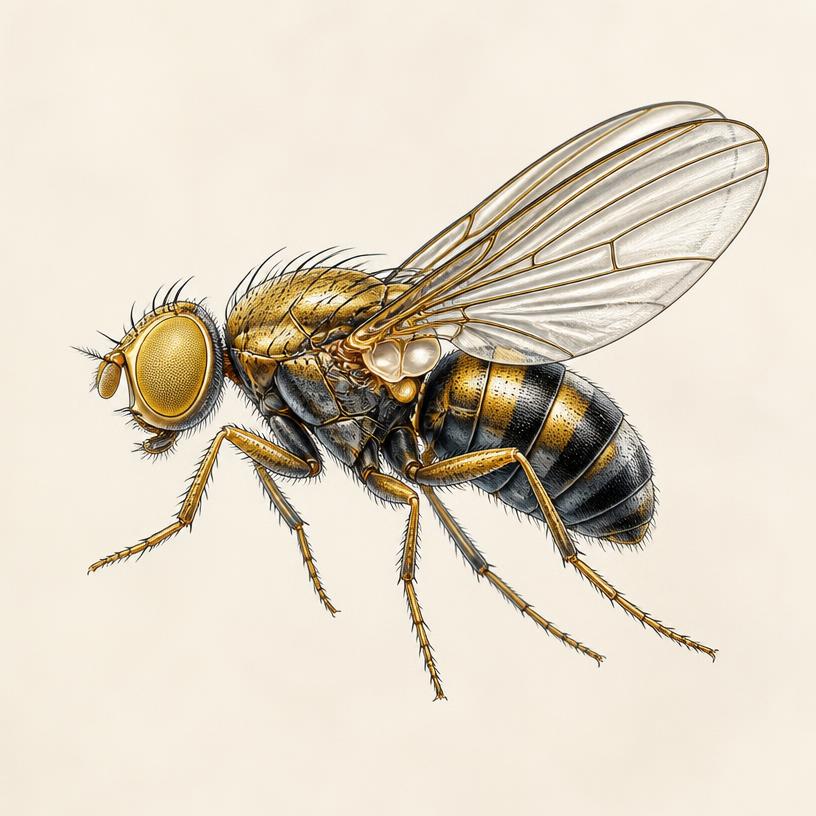 Zip♂ Zip♂ | 3,302 | 416 | 78% (620/790) |
Signaling pacesignals / hour, last 24h
Activity rises when several models are cued in the same window.
Live vs frozen replaycontrol group
- Live models · reply rate
- 26.1%
- Frozen replays · reply rate
- 24.8%
- Divergence
- +1.3 pts · within noise
Frozen models share the input history with fixed memory, isolating the effect of changing connections.
Neural time runs on the experiment host. If the host sleeps, these numbers pause instead of resetting. Raw counts can flatter a frequently shown fly, so preference questions always use responses divided by opportunities.
How the experiment works